Boxplot
Example
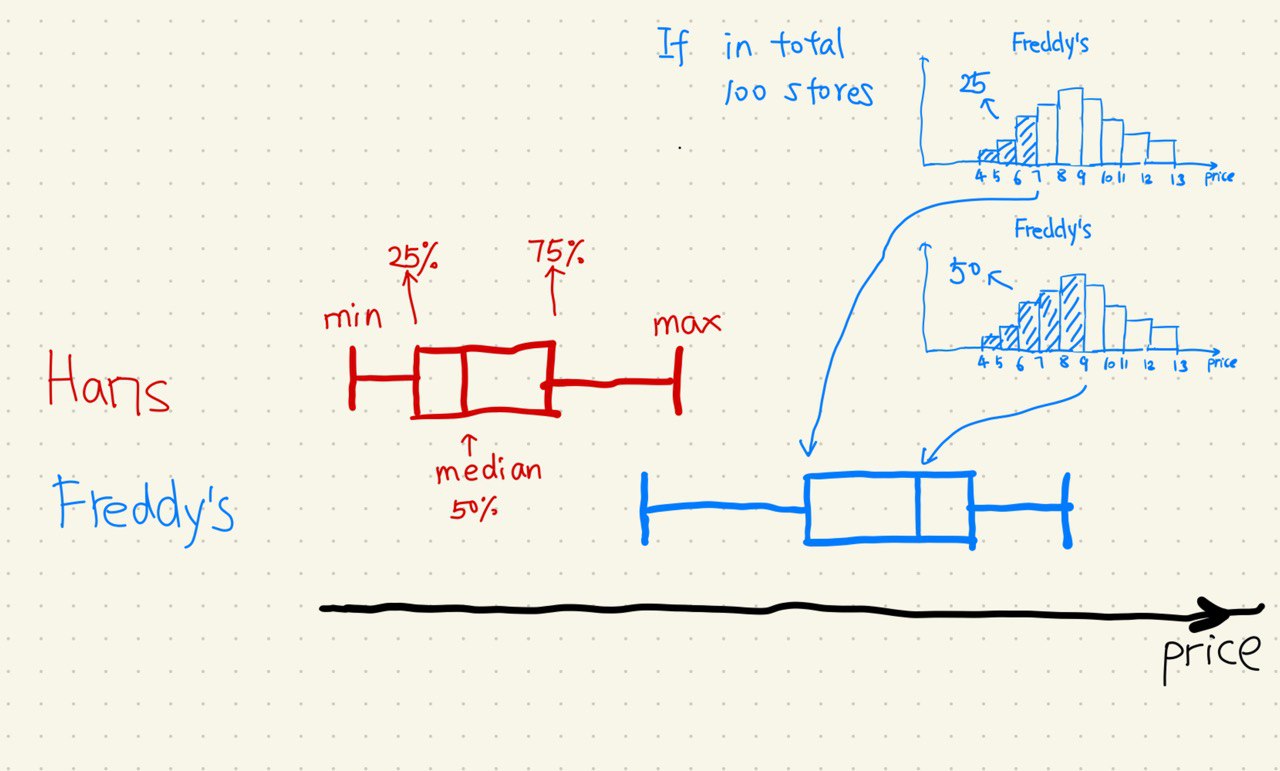
The Whiskers in Boxplot
They are the outlier data points.
Outliers are determined using the interquatile range (IQR, i.e., 25 percentile to 75 percentile.). We usually the lowest data point within 1.5 IQR range below the 25 percentile or the data point within 1.5 IQR range above the 75 percentile.
Planted:
by L Ma;
Dynamic Backlinks to
wiki/data-visualization/boxplots:wiki/data-visualization/boxplots Links to:L Ma (2019). 'Boxplot', Datumorphism, 08 April. Available at: https://datumorphism.leima.is/wiki/data-visualization/boxplots/.