ANOVA
In many problems, we have to test if several distributions associated with several groups of experiments are the same. The null hypothesis to be used is
The distributions of several groups are the same.
ANOVA tests the null hypothesis by comparing the variability between groups and within groups. If the variability between groups are significantly larger than the variability within groups, we are more confident that the distributions of different groups are different.
We will use two-group experiments as an example. We use a fake dataset:
| Group A |
|---|
| $x^A_1$ |
| $x^A_2$ |
| … |
| $x^A_{N_A}$ |
| Group B |
|---|
| $x^B_1$ |
| $x^B_2$ |
| … |
| $x^B_{N_B}$ |
Within Group Variability
The within group variability is proportional to
$$ \sigma_{in} \propto \sum_{i_A} (x_{i_A} - \bar x^A ) + \sum_{i_B} (x_{i_B} - \bar x^B ), $$
where $\bar x^A$ is the mean within group $A$ and $\bar x^B$ is the mean within group $B$.
We will play “the extreme game” to get the normalizing constant. We can tolerate larger $\sum_{i_A} (x_{i_A} - \bar x^A ) + \sum_{i_B} (x_{i_B} - \bar x^B )$ if we have more data points $N_A+N_B$ since a sum is likely to be larger for more data points. On the other hand, the more groups we have, the smaller $\sum_{i_A} (x_{i_A} - \bar x^A ) + \sum_{i_B} (x_{i_B} - \bar x^B )$ can be tolerated since the groups will start to overlap more easily.
A naive guess would lead to
$$ \sigma_{in} = \frac{\sum_{i_A} (x_{i_A} - \bar x^A ) + \sum_{i_B} (x_{i_B} - \bar x^B )}{N_A+N_B - k}, $$
where $k=2$ is the number of groups.
Between Group Variability
The between group variability is measured by the differences in the group means.
The mean of group A is $\bar x^A$ and the mean of group B is $\bar x^B$. Here we define the grand mean to be $\bar x = \sum_{\text{all in group A and B}} x_i/(N_A+N_B)$.
The variability between groups is proportional to the sum of variability based on the means
$$ \sigma_{between} = \frac{N_A(\bar x^A - \bar x )^2 + N_B(\bar x^B - \bar x )^2}{k}, $$
where $k=2$ is the number of groups.
ANOVA
ANOVA utilizes the F-test with F value defined as
$$ F = \frac{\sigma_{between}}{\sigma_{in}}. $$
The $p$ value can be looked up in a F-table.
Python Code
import numpy as np
import matplotlib.pyplot as plt
import scipy.stats as stats
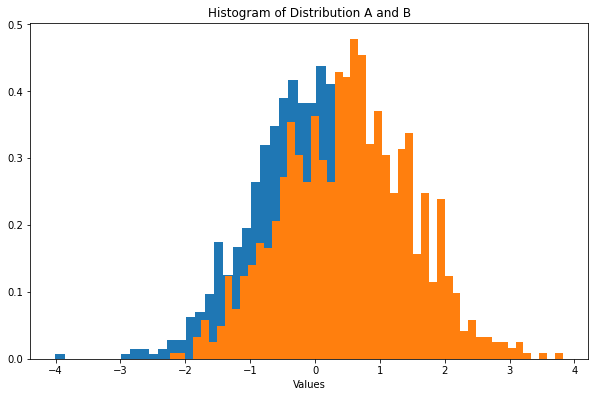
# Generate Gaussian data
a_dist = np.random.normal(loc=0, scale=1, size=1000)
b_dist = np.random.normal(loc=0.5, scale=1, size=1000)
# Create plot for the two distributions
fig, ax = plt.subplots(figsize=(10, 6.18))
ax.hist(a_dist, bins=50, density=True)
ax.hist(b_dist, bins=50, density=True)
ax.set_xlabel("Values")
ax.set_title("Histogram of Distribution A and B")
plt.show()
Now we can performance a one-way ANOVA.
# One-way ANOVA
stats.f_oneway(a_dist, b_dist)
We get
F_onewayResult(statistic=135.10932572037217, pvalue=2.873326981106292e-30)
N-way ANOVA
ANOVA test can be done even if we have multiple categorical variables, i.e., multiple . For example, for two variables, we build a table to investigate the possible effects with the rows being the classes of one variable and the columns being the classes of another variable. The samples spanned by these two directions can be used to test the effect of the variables on different combinations of the variables.
wiki/statistics/anova Links to:LM (2021). 'ANOVA', Datumorphism, 03 April. Available at: https://datumorphism.leima.is/wiki/statistics/anova/.