Random Forest
Random forest is an ensemble method based on decision trees. Instead of using one decision tree and model on all the features, the decision tree method can model on a random set of features (feature subspace) using many decision trees and make decisions by democratizing the trees.
Given a proper dataset $\mathscr D(\mathbf X, \mathbf y)$, the ensemble of trees is denoted as ${f_i(\mathbf X)}$, will predict an ensemble of results. There are several key ideas in random forests.
- Are the predicted results representative?
- How to democratize the ensemble of results?
- What determines the quality of the predictions?
Margin, Strength, and Correlations
The margin of the model, the strength of the trees, and the correlation between the trees are crucial to answer the questions.
Margin
The margin of the tree is defined as
$$ M(\mathbf X, \mathbf y) = P (f_i(\mathbf X)=\mathbf y ) - \operatorname{max}_{\mathbf j\neq \mathbf y} P ( f_i(\mathbf X) = \mathbf j ). $$
The first term, $P (f_i(\mathbf X)=\mathbf y )$ is the probability of predicting the exact value in the dataset. It can be calculated using
$$ P (f_i(\mathbf X)=\mathbf y ) = \frac{sum_{i=1}^N I(f_i(\mathbf X) = \mathbf y)}{N}, $$
where $I$ is the indicator function that maps the correct predictions to 1 and the incorrect predictions to 0.
The term $P ( f_i(\mathbf X) = \mathbf j )$ is the probability of predicting other values $\mathbf j$. The second term $\operatorname{max}_{\mathbf j\neq \mathbf y} P ( f_i(\mathbf X) = \mathbf j )$ finds the maximum the the probabilities of predicting values $\mathbf j$ other than $\mathbf y$, i.e., the most probable predicted value other than the correct value.
Thus we expect that the ensemble predicts the correct result if $M(\mathbf X, \mathbf y)>0$.
Notice that these probabilities are over the trees, i.e., the subscript $i$.
If all the predictions in all the trees are predicting the correct values $\mathbf y$, the margin will be 1. If all the predictions are not correct, the margin is -1. If we have two predicted values and probabilities of each of the predictions are equal, the margin is 0.
Strength
The expectation values of the margin over the dataset is the strength, i.e.,
$$ s = E_{\mathscr D}[M(\mathbf X, \mathbf y)]. $$
Raw Margin
Instead of using the probability of the predictions in the margin, the indicator function itself is also a measure of how well the predictions are. The raw margin is then defined as
$$ M_{R,i}(\mathbf X, \mathbf y) = I (f_i(\mathbf X)=\mathbf y ) - \operatorname{max}_{\mathbf j\neq \mathbf y} I ( f_i(\mathbf X) = \mathbf j ). $$
Correlation
The correlation between the trees is
$$ \rho_{ij} = \operatorname{corr}(M_{R,i}, M_{R,j}) = \frac{\operatorname{cov}(M_{R,i}, M_{R,j})}{\sigma_{M_{R,i}} \sigma_{M_{R,j}}} = \frac{E[(M_{R,i} - \bar M_{R,i})(M_{R,j} - \bar M_{R,j})]}{\sigma_{M_{R,i}} \sigma_{M_{R,j}}}. $$
The correlation tells us how strong the two trees are correlated. If all trees are exactly the same, then the correlation is infinite, which means the ensemble is not doing the work.
To get a scalar value of the whole model, the average correlation $\bar \rho$ over all the possible pairs is calculated.
Predicting Power
The power of the ensemble can be measure by the generalization error,
$$ P_{err} = P_{\mathscr D}(M(\mathbf X, \mathbf y)< 0), $$
i.e., the probability of getting the correct answer over the whole dataset.
It has been proved that the ensemble will converge in the random forest as the number of trees gets large. And the generalization error is proven to be related to the strength and the mean correlation,
$$ P_{err} \leq \frac{\bar \rho (1-s^2) }{s^2}. $$
We conclude that
- The stronger the strength is, the lower the generalization error is.
- The smaller the correlation is, the lower the generalization error is.
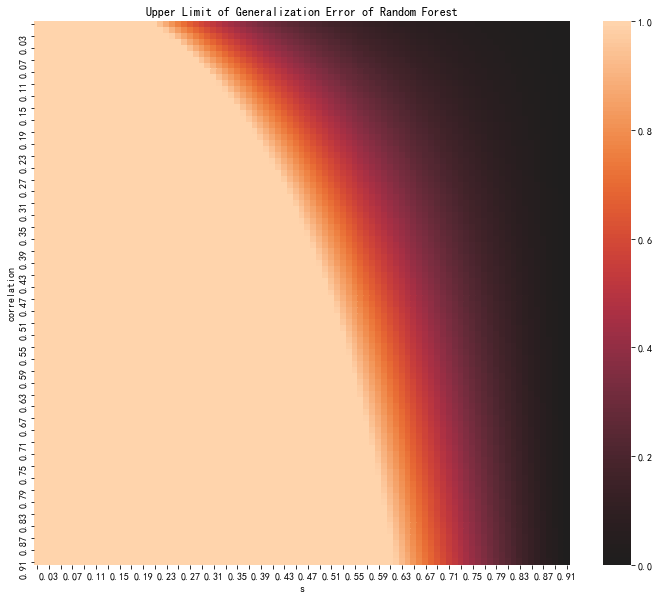
Upper Limit of generalization error as functions of $\bar \rho$ and $s$.
Random Forest Regressor
Similar to decision trees, a random forest can also be used as regressors. A similar conclusion about the regressors can be proved.
To see how the regressor works, we construct an artificial problem. The code can be accessed on GitHub.
The data we will use is generated by sin function.
X_sin = [[6*random()] for i in range(10000)]
y_sin = np.sin(X_sin)

X_sin_test = [[6*random()] for i in range(10000)]
y_sin_test = np.sin(X_sin_test)
A random forest model is constructed and a random search cross vaidation is applied
model = RandomizedSearchCV(
    pipeline,
    cv=10,
    param_distributions = rf_random_grid,
    verbose=3,
    n_jobs=-1
)
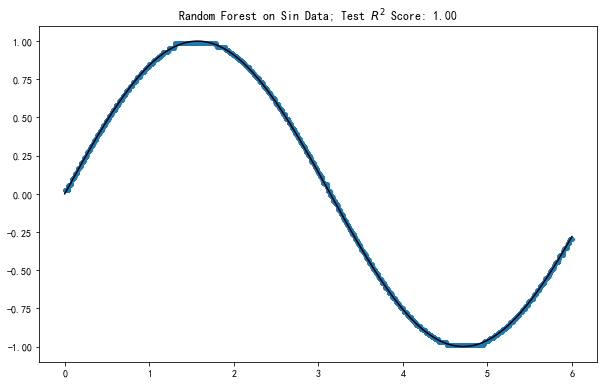
Random forest on a dataset generated by sin function. The rather dense dots are the predicted results. The black line is the ground truth.
The predictions at each data point is quite concentrated, as the convergence has been proved.
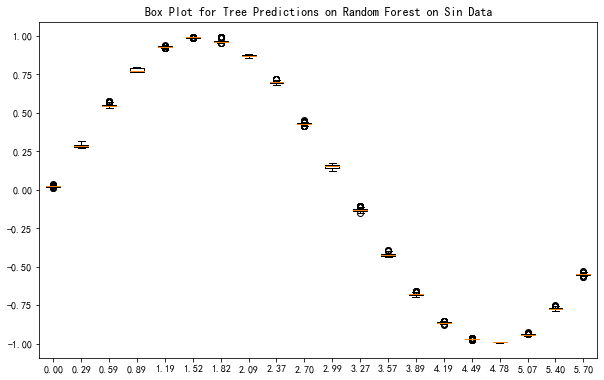
Boxplot of the predicted results of the trees in the ensemble. The quantiles are small.
In fact, it has also been shown by G. Biau that as the number of estimators grows, the trees will be focusing more on the informative variables.
wiki/machine-learning/tree-based/random-forest:wiki/machine-learning/tree-based/random-forest Links to:L Ma (2019). 'Random Forest', Datumorphism, 12 April. Available at: https://datumorphism.leima.is/wiki/machine-learning/tree-based/random-forest/.