Workflows
Data wrangling is mostly guided by the exploratory data analysis (EDA). In other words, the data cleaning process should be mostly guided by questions from business and stakeholder or out of curiosity.
There are three key components in EDA.
- Clearly state the purpose of this EDA.
- Are we asking the right question?
- Does the dataset fit in memory or shall I use distributed preprocessing?
- Is the dataset good enough to solve the problem?
- Is there anything we already know from the experts?
- What are the next steps after EDA?
- …
- Go through a checklist and report results. Most elements on the checklist is dynamic and should be generated by some questions you need to answer.
- Polish the Questions
- Data Quality and Summary
- …
- Communicate with domain experts or stakeholders and yourself.
- Do the results from EDA make sense to the experts?
- What do the experts want to know from the data?
This is an iteration process. One could get start from any point and iterate the cycle to reach a certain satisfaction.
For data quality checks, we have a somewhat standard checklist to go through. It is not a complete checklist. In this process, more questions will pop out, and one also should attend to these questions as part of the checklist.

The Checklist
Data Quality and Summary PNG PDF
Validating the data quality and generate summary statistics reports.
- Rows and Columns : The questions to be answered serve as guides in EDA
-
Rows
-
Descriptions
What does the row mean?
- Count
-
Descriptions
-
Columns
-
Descriptions
What does the column mean?
-
Count
How many columns?
-
Possible values or ranges
List the theoretical limits on the values and validate against the data.
-
Descriptions
-
Rows
- Types and Formats :
-
Data Types
What is each column consists of?
-
Types of data
Ordinal, Nominal, Interval, Generative, etc
- Is the type of the data correct
-
Types of data
-
Data Formats
- Are the dates loaded as dates?
-
Are the numbers loaded as numbers?
Are they strings?
-
Are the financial values correct?
Are they strings or numbers? EU format, US format?
-
Data Types
- Missing Values : Are there missing values in each column
-
Different types of missing values
Notations of missing values are different in different datasets. Read the documentation of the dataset to find out.
-
Standard missing values
nan, nat, None, na, null...
-
Represented with a specific value
-1, 0, MISSING, ...
-
Standard missing values
- Percentage of missing values in each column
-
Visualizations
e.g., missingno python package
-
Different types of missing values
- Duplications : Are there duplications of rows/columns?
-
Validate by yourself
Do not trust the metadata and documentation of the dataset. Duplications of fields may occur when the documentation says they are unique.
-
Validate by yourself
- Distributions :
-
What is the generation process?
- Is it a histogram analysis of another row?
- Is it a linear combination of other rows?
-
Visualize the distributions of the values
Know all the values
-
Value count bar plot
For descrete data, list all possible values and counts
-
Histogram and KDE
for continuous data, use histograms or KDE.
-
Boxplot
Boxplot is easier to understand for business people
-
Scatter plot
Gut feeling of where the data points are located
- Contour plot
-
Value count bar plot
-
Dispersion of the target value
Is the dispersion of the target value small enough for the algorithm to perform a good prediction?
-
Numerical Summarization
Use summary statistics to find out the moments.
-
Locations
Mean, median, quartiles, mode...
-
Spreads
range, variance, standard deviation, IQR
-
Skewness
asymmetries
- Kurtosis
-
Locations
-
What is the generation process?
- Correlations, Similarities :
- Pairplot
-
Correlations
Pearson, Kendall Tau Correlation
-
Distances
Calculate the distance between features or rows to understand the relations between them; Euclidean distance, Mahalanobis distance, Minkowski distance, Jaccard distance, ...
- Size : How much space will the data take on our storage device?
-
Memory usage
To estimate the hardware requirements when deploying the model
-
Storage on Hard Drive in Different Formats
How much space will the dataset take in different formats?
-
Memory usage
- Combining Data Files : One dataset may come in different files, combine them carefully.
-
Concat
The files should be concated with caution.
-
Validate overlap
Check if there is an overlap between the files.
-
Validate overlap
-
Concat
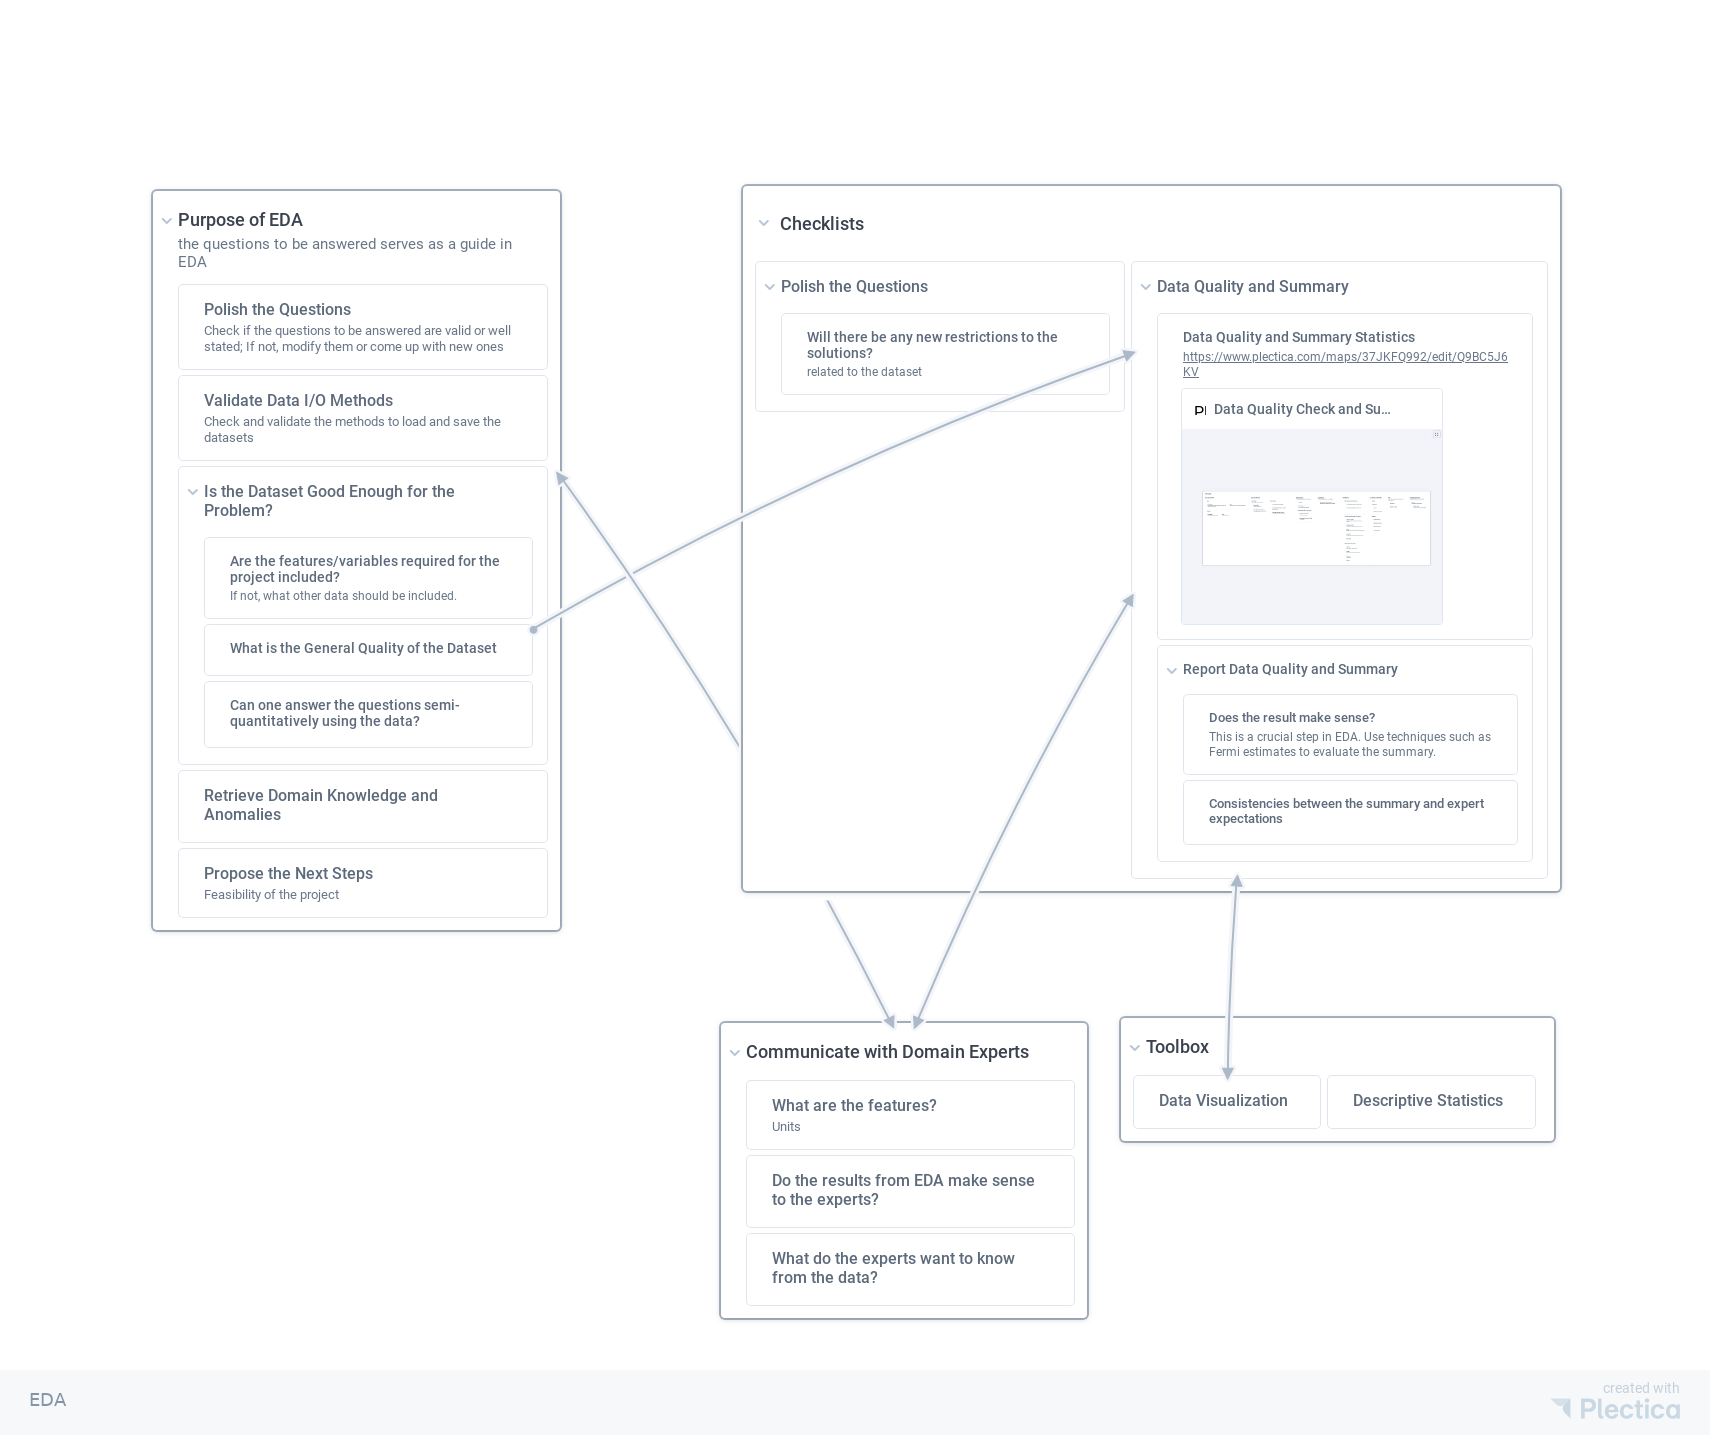
Exploratory Data Analysis PNG PDF
EDA is one of the very first steps of my data science projects.
- Objectives of EDA : The questions to be answered serve as guides in EDA
-
Polish the Questions
Check if the questions to be answered are valid or well stated; If not, modify them or come up with new ones
-
Validate Data I/O Methods
Check and validate the methods to load and save the datasets
-
Is the Dataset Good Enough for the Problem?
-
Are the features/variables required for the project included?
If not, what other data should be included.
- What is the General Quality of the Dataset
-
Can one answer the questions semi-quantitatively using the data?
Is the dispersion of the target value small enough?
-
Are the features/variables required for the project included?
-
Retrieve Domain Knowledge and Anomalies
Determine the ranges, outliers of the dataset; Talk to domain experts and validate with domain experts.
- Propose the Next Steps
-
Polish the Questions
- Communicate with Domain Experts :
-
What are the features?
Pay attention to the units
- Do the results from EDA make sense to the experts?
- What do the experts want to know from the data?
-
What are the features?
- Workflow :
-
Polish the Questions
-
Will there be any new restrictions to the solutions?
related to the dataset
-
Will there be any new restrictions to the solutions?
-
Data Quality and Summary
- Data Quality and Summary Statistics
-
Report Data Quality and Summary
-
Does the result make sense?
This is a crucial step in EDA. Use techniques such as Fermi estimates to evaluate the summary.
- Consistencies between the summary and expert expectations
-
Does the result make sense?
-
Polish the Questions
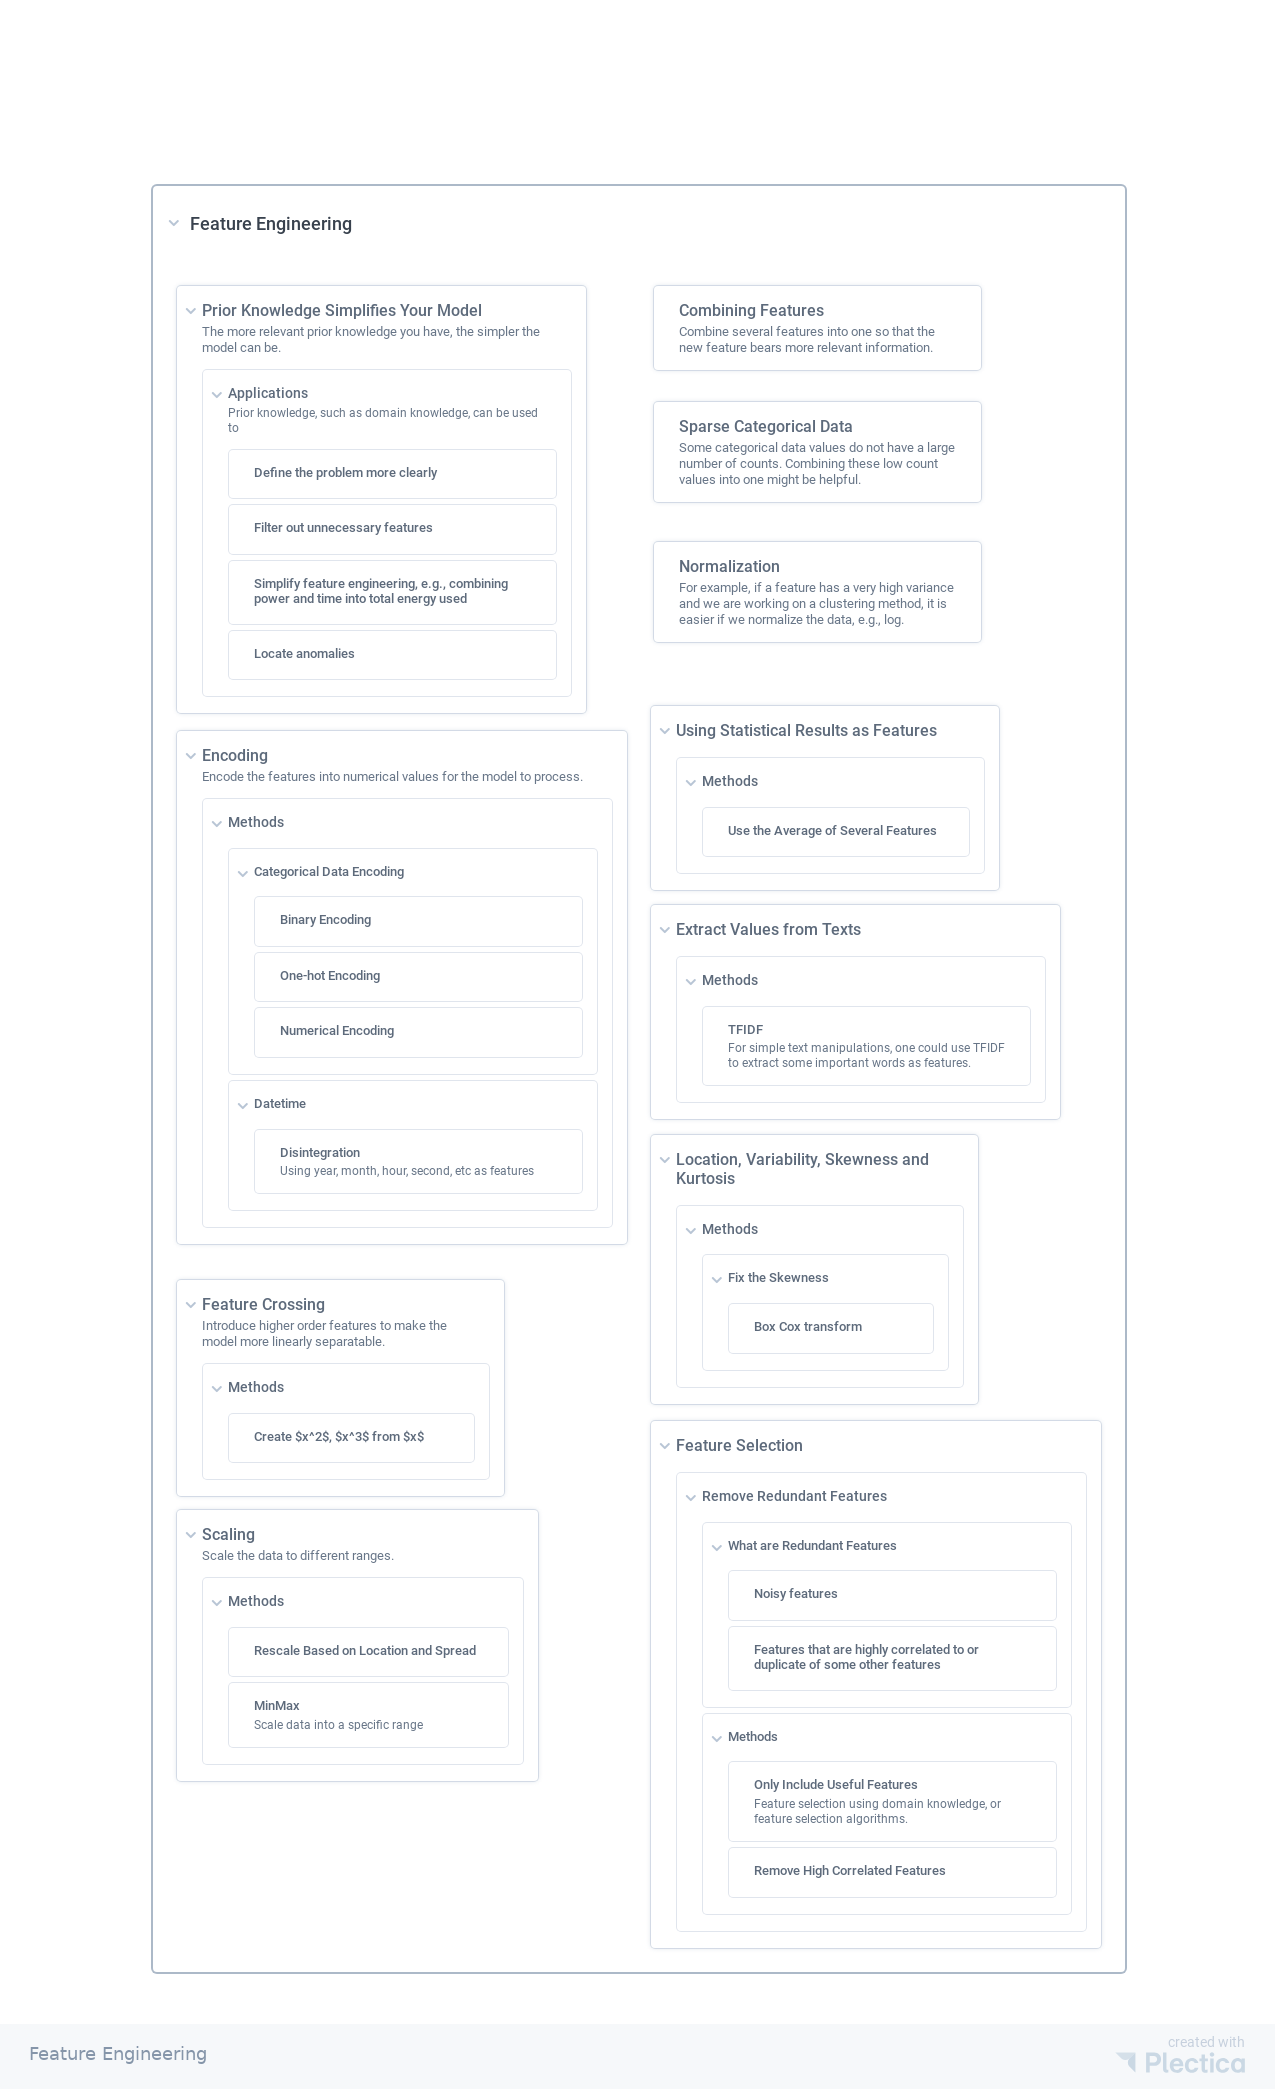
Feature Engineering PNG PDF
Feature Engineering is one of the fundamental activities of data science. This is an practical outline of feature engineering in data science.
- Prior Knowledge Simplifies Your Model : The more relevant prior knowledge you have, the simpler the model can be.
-
Applications
Prior knowledge, such as domain knowledge, can be used to
- Define the problem more clearly
- Filter out unnecessary features
-
Simplify feature engineering
e.g., combining power and time into total energy used
- Locate anomalies
-
Applications
- Encoding : Encode the features into numerical values for the model to process.
-
Methods
-
Categorical Data Encoding
- Binary Encoding
- One-hot Encoding
- Numerical Encoding
-
Datetime
- Disintegration
-
Categorical Data Encoding
-
Methods
- Feature Crossing : Introduce higher order features to make the model more linearly separable.
-
Methods
- Create $x^2$, $x^3$ from $x$
-
Methods
- Scaling : Scale the data to different ranges.
-
Methods
- Rescale Based on Location and Spread
-
MinMax
Scale data into a specific range
-
Methods
- Combining Features : Combine several features into one so that the new feature bears more relevant information.
- Sparse Categorical Data : Some categorical data values do not have a large number of counts. Combining these low count values into one might be helpful.
- Normalization : For example, if a feature has a very high variance and we are working on a clustering method, it is easier if we normalize the data, e.g., log.
- Using Statistical Results as Features :
-
Methods
- Use the Average of Several Features
-
Methods
- Extract Values from Texts :
-
Methods
- TFIDF
-
Methods
- Location, Variability, Skewness and Kurtosis :
-
Methods
-
Fix the Skewness
- Box Cox transform
-
Fix the Skewness
-
Methods
- Feature Selection :
-
Remove Redundant Features
-
What are Redundant Features
- Noisy features
- Features that are highly correlated to or duplicate of some other features
-
Methods
-
Only Include Useful Features
Feature selection using domain knowledge, or feature selection algorithms.
- Remove High Correlated Features
-
Only Include Useful Features
-
What are Redundant Features
-
Remove Redundant Features
L Ma (0001). 'Workflows', Datumorphism, 01 April. Available at: https://datumorphism.leima.is/awesome/workflows/.
Table of Contents
References:
Current Note ID:
- awesome/workflows/index.md